
Break-even ROAS is 1 divided by your contribution margin before advertising, provided both use the same revenue definition. If an ad dashboard counts revenue differently, its comparable threshold changes.
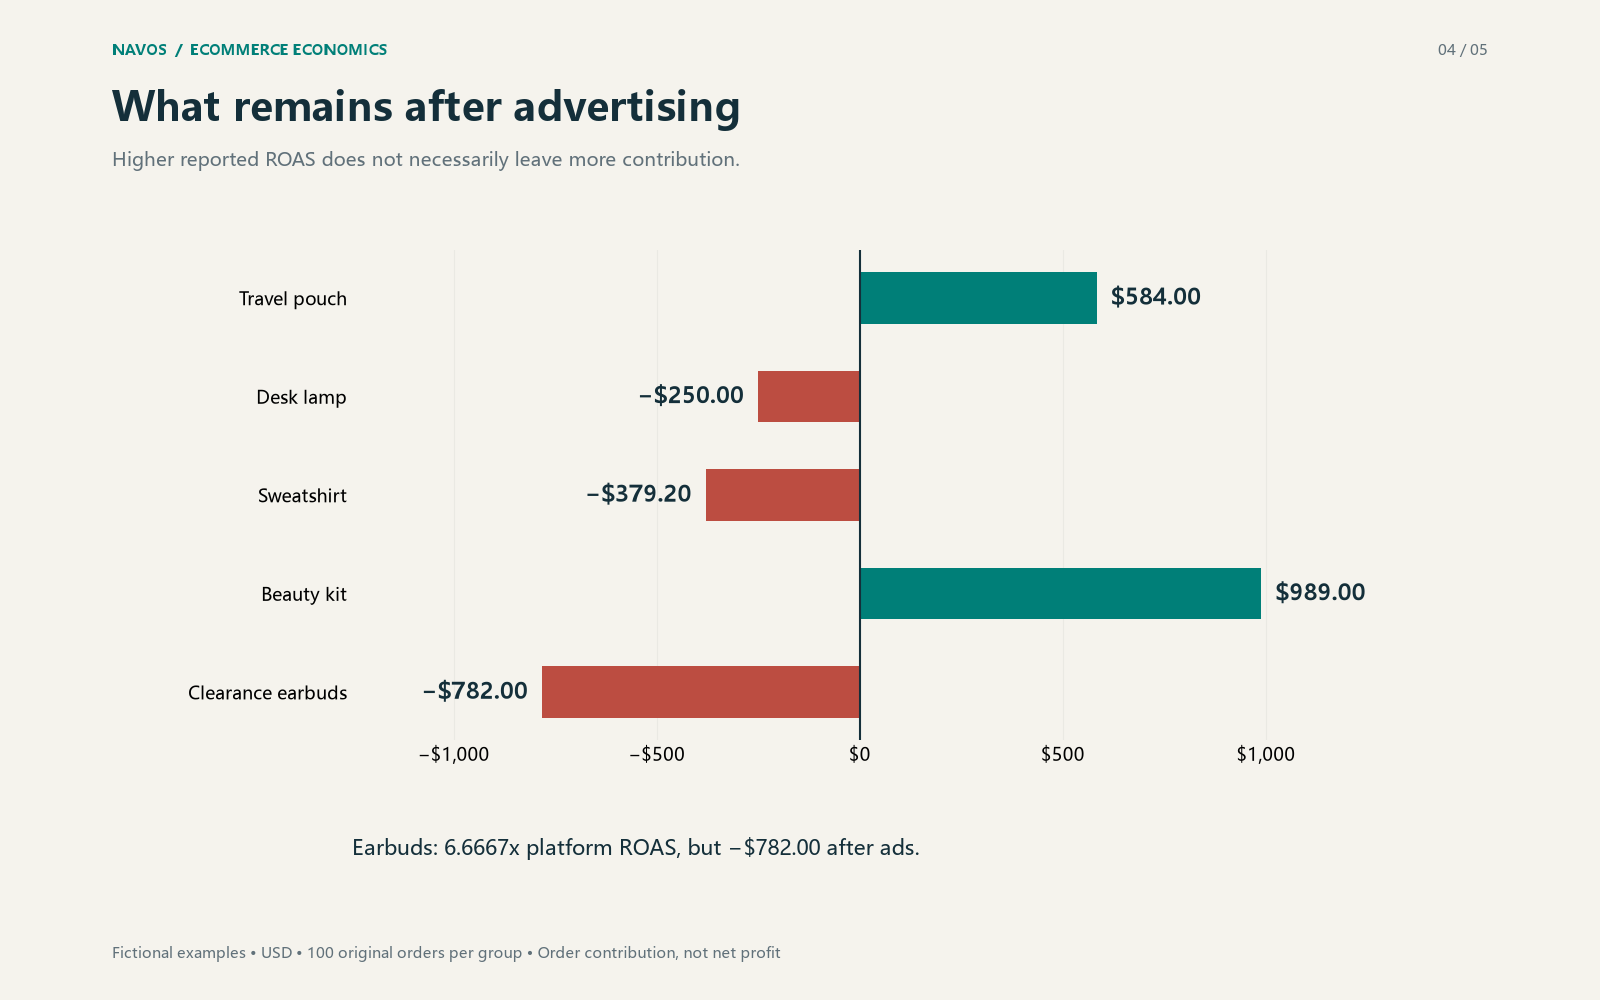
That distinction matters when a report looks encouraging but the orders leave little room for ads. In the fictional sweatshirt example below, a 5.4x platform ROAS still leaves a negative $379.20 contribution after advertising. Shipping, refunds, fees and commissions all affect how much you can spend to acquire those orders.
These five examples use USD and 100 original orders each. They measure order contribution after variable costs and advertising. Fixed overhead, income tax, future repeat purchases and causal advertising impact are outside the calculation.
1. Start with the contribution available for ads
Let R be revenue after discounts and actual product refunds, plus retained customer shipping charges. Let V be all non-ad variable costs, net of fee credits.
The amount left for advertising is your pre-ad contribution:
C = R − V
When C is positive, the order group can spend up to C on advertising before its contribution falls to zero. Therefore:
Revenue-based break-even ROAS = R ÷ C = 1 ÷ (C ÷ R)
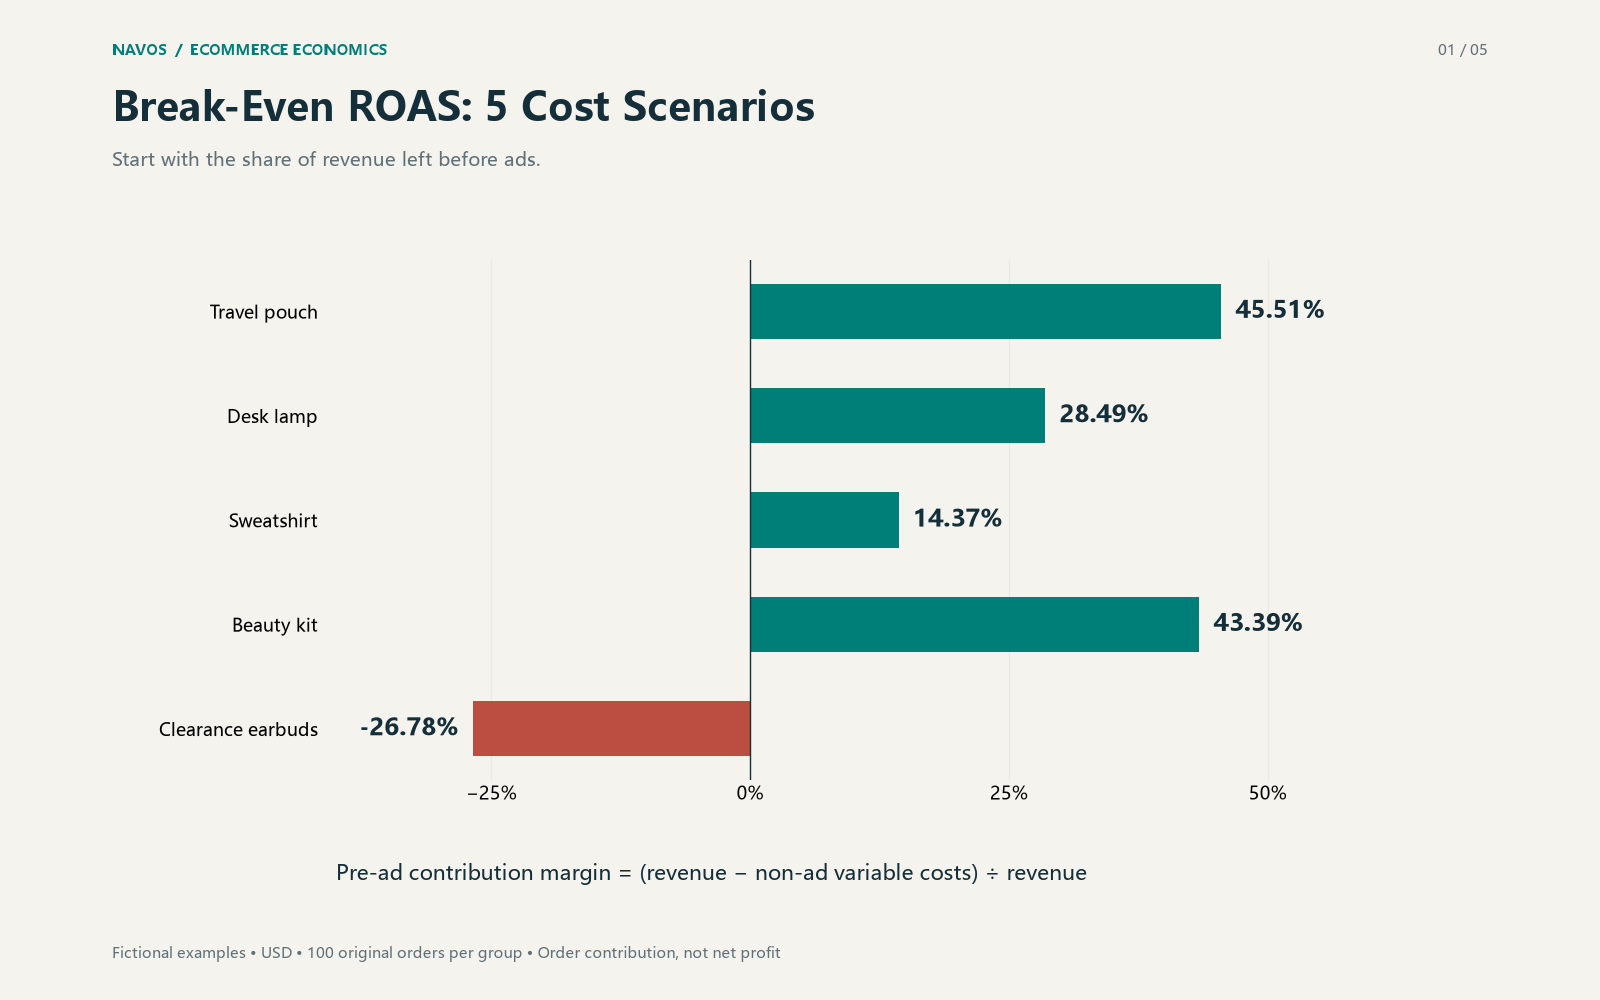
Use the margin as a decimal: 40% becomes 0.40. In the travel pouch example, revenue is $3,920.00 and pre-ad contribution is $1,784.00. Dividing the two gives a revenue-based floor of 2.1973x.
Check what your margin includes before using the shortcut. A margin that deducts only purchase cost overstates your advertising allowance if shipping, processing fees and other variable costs still need to be paid. Shopify's product profit reporting, for example, distinguishes net sales and recorded product cost; you still need to identify the other costs relevant to your own order model.
2. Build the cost stack before choosing a threshold
Keep customer shipping income and carrier expenses in separate rows. Deduct fee credits once. If a commission figure is already net of reversals, do not subtract those reversals again.
Here is the complete input behind the examples. All amounts are USD per 100 original orders. A zero means the item is known to be absent.
Input | Pouch | Lamp | Sweatshirt | Beauty kit | Earbuds |
Original product sales | 4,000.00 | 9,000.00 | 6,000.00 | 7,500.00 | 2,500.00 |
Discounts | 0.00 | 900.00 | 600.00 | 0.00 | 500.00 |
Actual product refunds | 80.00 | 0.00 | 1,080.00 | 150.00 | 200.00 |
Retained customer shipping | 0.00 | 500.00 | 0.00 | 0.00 | 0.00 |
Platform product value Q | 4,000.00 | 8,100.00 | 5,400.00 | 7,500.00 | 2,000.00 |
Shipped product COGS | 1,200.00 | 3,500.00 | 2,000.00 | 1,800.00 | 1,400.00 |
Outbound carrier | 500.00 | 1,800.00 | 600.00 | 500.00 | 400.00 |
Fulfillment | 200.00 | 300.00 | 250.00 | 250.00 | 150.00 |
Packaging | 100.00 | 250.00 | 150.00 | 150.00 | 100.00 |
Payment fees | 140.00 | 300.00 | 180.00 | 240.00 | 80.00 |
Marketplace fees | 0.00 | 0.00 | 120.00 | 450.00 | 100.00 |
Net affiliate commissions | 0.00 | 0.00 | 259.20 | 750.00 | 0.00 |
Return carrier | 20.00 | 0.00 | 140.00 | 20.00 | 40.00 |
Return handling | 0.00 | 0.00 | 60.00 | 10.00 | 20.00 |
Fee credits to subtract | 24.00 | 0.00 | 60.00 | 9.00 | 8.00 |
Advertising spend A | 1,200.00 | 2,700.00 | 1,000.00 | 2,200.00 | 300.00 |
COGS includes the cost of bringing products into inventory. Fulfillment excludes carrier costs and packaging. Payment and marketplace fees are gross, before the listed credits. Returned products have no recoverable inventory value in these examples.
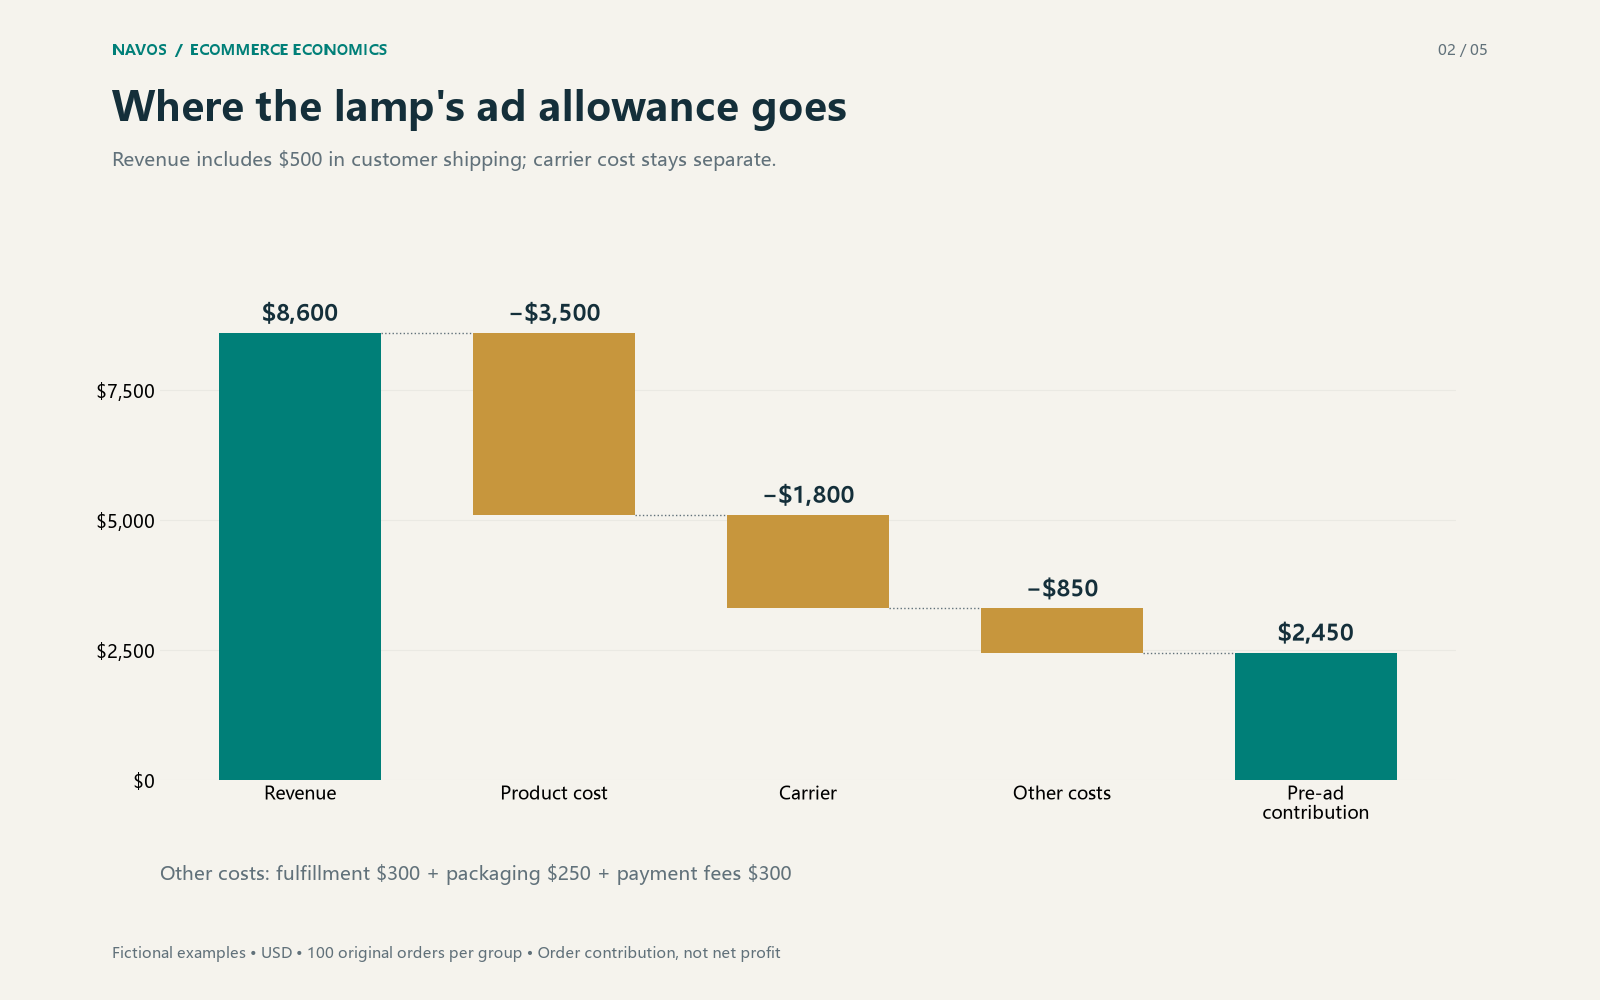
For the desk lamp, $8,600.00 of revenue becomes $2,450.00 of contribution after $6,150.00 of non-ad variable costs. That $2,450.00 is the group's break-even advertising allowance.
3. Match the threshold to the dashboard's revenue
In this model, Q is one platform's product conversion value for exactly the same orders. It is after discounts but before refunds, and excludes shipping and tax. Your actual tracking setup may use another definition.
Because the dashboard reports Q ÷ A, compare it with Q ÷ C, not automatically with R ÷ C. With positive Q, A and C, the group covers advertising when Q/A is at least Q/C. Equality means no contribution remains after ads.
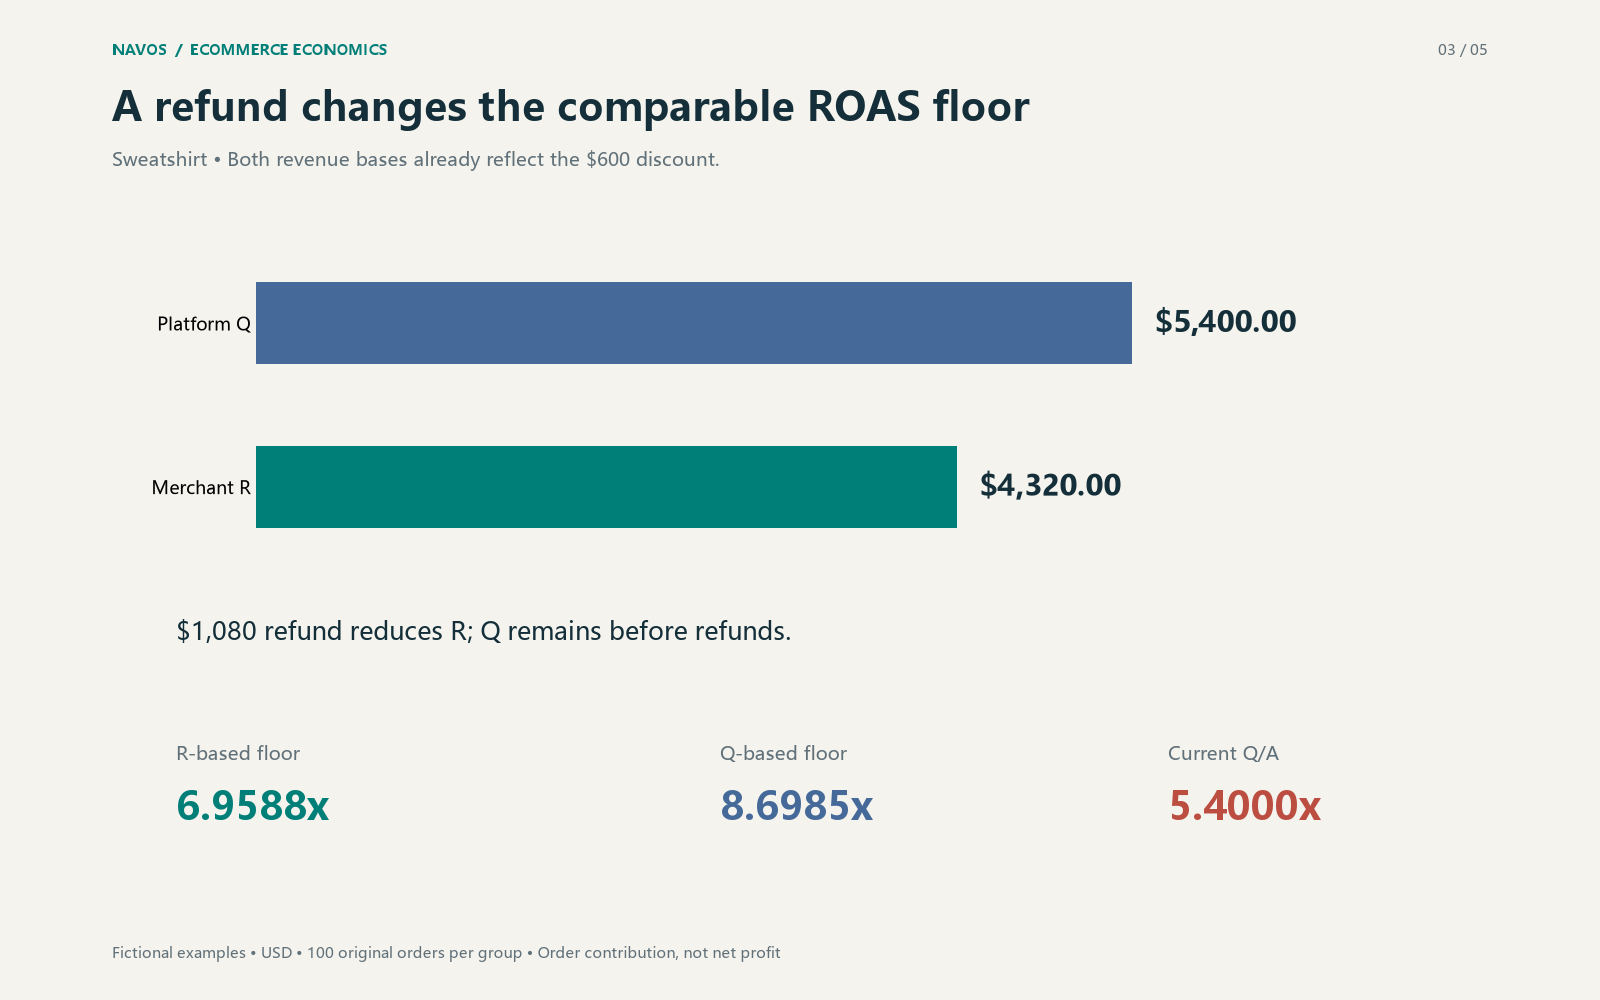
The sweatshirt makes the difference visible. Both R and Q reflect the $600.00 discount. The $1,080.00 refund then reduces R to $4,320.00, while Q stays at $5,400.00. The comparable platform floor is 8.6985x; the revenue-based floor is 6.9588x.
The lamp goes the other way: retained shipping income makes R higher than Q. Its comparable platform floor is 3.3061x, below its revenue-based floor of 3.5102x.
Before using a live dashboard, check how its conversion values handle refunds and shipping. Google Ads supports conversion value adjustments, but that does not establish whether a particular account has submitted them.
Keep the order group and attribution scope consistent, too. Do not add two platforms' claimed revenue when they credit the same order. For the broader GMV Max reporting scope, use the GMV Max ROI and contribution guide.
4. Five cost scenarios, five different ad limits
The completed calculations show why ranking products by reported ROAS alone gives an incomplete picture.
Scenario | Revenue R | Non-ad costs V | Pre-ad contribution C | Ad spend A | Contribution after ads |
Travel pouch | $3,920.00 | $2,136.00 | $1,784.00 | $1,200.00 | $584.00 |
Desk lamp | $8,600.00 | $6,150.00 | $2,450.00 | $2,700.00 | −$250.00 |
Sweatshirt | $4,320.00 | $3,699.20 | $620.80 | $1,000.00 | −$379.20 |
Beauty kit | $7,350.00 | $4,161.00 | $3,189.00 | $2,200.00 | $989.00 |
Clearance earbuds | $1,800.00 | $2,282.00 | −$482.00 | $300.00 | −$782.00 |
Travel pouch: room to cover advertising
The pouch retains a 45.51% pre-ad contribution margin. Its current platform ROAS of 3.3333x exceeds the comparable 2.2422x floor, leaving $584.00 after ads.
That remaining contribution can help cover overhead. It does not establish the business's net profit.
Desk lamp: shipping absorbs more of the revenue
The lamp collects $500.00 from customers for shipping but pays $1,800.00 to the carrier. After all non-ad variable costs, it can support $24.50 of advertising per original order on average. Actual advertising averages $27.00.
Its 3.0000x platform ROAS is below the 3.3061x floor. Reviewing the freight cost and the offer is more useful than borrowing another product's ROAS target.
Sweatshirt: refunds change what 5.4x means
Refunds remove $1,080.00 of product revenue. Shipped product costs remain in the model, and return carrier and handling costs also have to be covered.
The group leaves only $620.80 before advertising. Its maximum average advertising cost per original order is $6.208, displayed as $6.21. Actual spend averages $10.00. Use the unrounded value for a precise spending calculation.
Beauty kit: commissions fit inside this cost structure
The beauty kit pays $750.00 in net affiliate commissions and $450.00 in marketplace fees. It still retains $3,189.00 before ads.
At a 3.4091x platform ROAS, it leaves $989.00 after advertising, the largest absolute post-ad contribution among these five groups. This result belongs to the stated costs; it is not a beauty-category benchmark.
Clearance earbuds: high ROAS cannot repair negative contribution
The earbuds show the highest platform ROAS, 6.6667x. Yet their variable costs already exceed revenue by $482.00 before advertising.
Their pre-ad contribution rate is −26.78%. No positive advertising allowance exists for this order group, so there is no actionable positive break-even ROAS or maximum CPA. A lower ad bill alone cannot make these unchanged orders contribute positively.
For comparison, the thresholds are:
Scenario | R-based floor | Comparable Q-based floor | Current Q/A | Maximum average ad cost per original order |
Travel pouch | 2.1973x | 2.2422x | 3.3333x | $17.84 |
Desk lamp | 3.5102x | 3.3061x | 3.0000x | $24.50 |
Sweatshirt | 6.9588x | 8.6985x | 5.4000x | $6.21* |
Beauty kit | 2.3048x | 2.3518x | 3.4091x | $31.89 |
Clearance earbuds | No positive threshold | No positive threshold | 6.6667x | No positive allowance |
Rounded from $6.208. These are group averages across 100 original orders, not new-customer acquisition costs.
5. Count refunds and fee credits once
All five examples use mature refunds assigned back to the original order group. They do not add another reserve for the same refund losses.
For a newer group, you may need a separately labeled estimate for refunds that have not happened yet. Keep it distinct from actual refunds, and update the estimate as outcomes arrive.
Also check whether returned stock retains value, whether fees were refunded, and whether your exported commissions are gross or net. In these examples, stock recovery is zero, commissions are already net, and fee credits reduce costs once. Other assumptions need different inputs.
Missing shipping expense must remain missing. In the separate lamp example with unknown carrier cost S, contribution before ads is $4,250.00 − S and contribution after ads is $1,550.00 − S. The current platform ROAS is still 3.0000x, but it cannot settle the contribution question without S.
6. Set a contribution target above break-even
Break-even spends the entire pre-ad contribution on advertising. If you want a proportion p of revenue left afterward, the allowance becomes:
Advertising allowance = C − pR
Comparable target ROAS = Q ÷ (C − pR)
The target requires a positive allowance. A zero allowance leaves no room for positive ad spend and no finite ROAS target; a negative allowance means the desired contribution cannot be achieved even with zero advertising under the same inputs.
Using 10% only as an illustration:
Scenario | Allowance after reserving 10% of R | Comparable target ROAS |
Travel pouch | $1,392.00 | 2.8736x |
Desk lamp | $1,590.00 | 5.0943x |
Sweatshirt | $188.80 | 28.6017x |
Beauty kit | $2,454.00 | 3.0562x |
Clearance earbuds | −$662.00 | Infeasible |
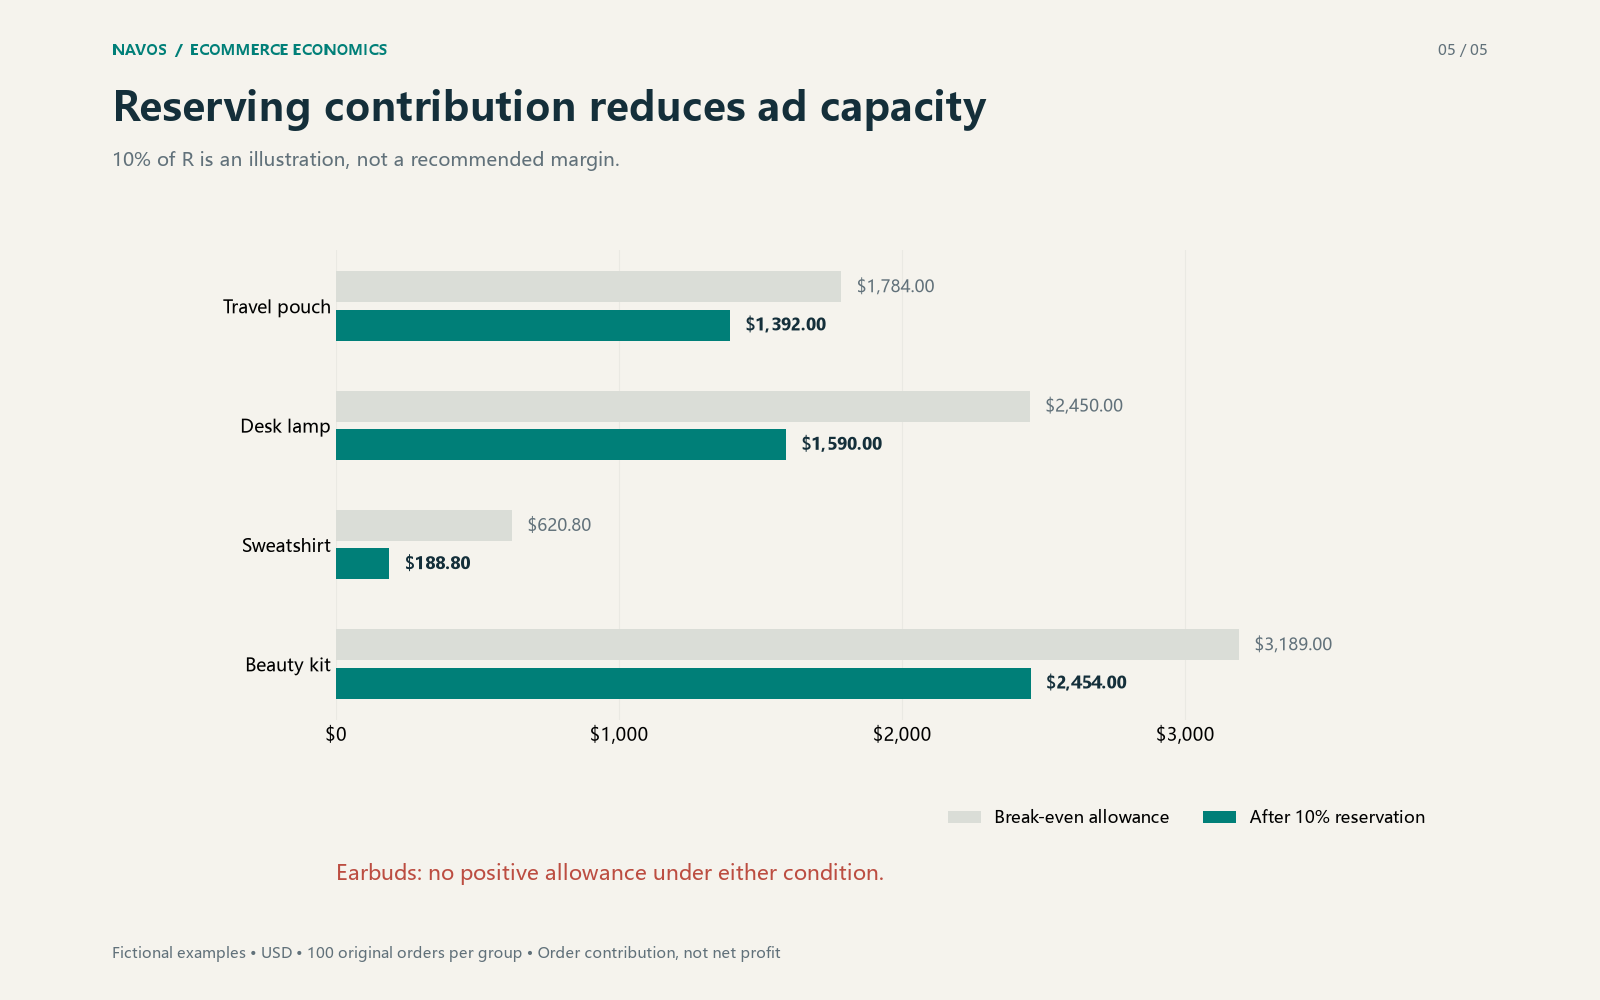
The sweatshirt's 28.6017x figure shows how little advertising capacity remains under that assumption. It is not a recommendation to enter that number into a bidding system.
Ten percent is not a recommended margin. Choose your own contribution requirement using the costs and obligations the business must cover. These calculations hold the order group's revenue and cost structure fixed; they do not forecast what will happen when spend changes.
If orders are failing to materialize, start with the ad-clicks-to-sales diagnostic before treating a ROAS target as the solution.
7. Review your cost scenarios in Navos
Navos can help turn a stated cost model into a report you can inspect. For this article, we supplied the five fictional order groups through E-commerce Cost & Profit Analysis. The reviewed HTML report contains their contribution calculations, both revenue bases, advertising limits and target scenarios.
The separate missing-shipping exercise retained S as an unknown instead of treating it as zero. That makes the next action specific: obtain the carrier expense before deciding whether those orders cover ads.
To prepare your own review:
- Choose one product or order group, a currency and a time window.
- List the revenue definition, every variable cost, fee credits and ad spend. Mark unknowns explicitly.
- Ask for contribution before and after ads, the comparable ROAS floor and average advertising allowance per original order.
- Review the calculations and missing fields before using the result in a spending decision.
Download Navos Desktop, then look for E-commerce Cost & Profit Analysis under Square → Ecommerce Hacks. Start with the cost information you already have. The demonstration here used supplied fictional figures and did not require a connected store.
8. Frequently asked questions
What is the break-even ROAS formula?
For positive pre-ad contribution C, use revenue divided by C. This equals 1 divided by the pre-ad contribution margin when the revenue basis matches. For a dashboard using Q, compare Q/A with Q/C.
Is 3x ROAS good?
It depends on costs and revenue scope. The lamp needs more than 3x to leave positive contribution after ads in this example. The pouch has a lower comparable floor.
Does this include fixed overhead?
No. These thresholds cover the stated non-ad variable costs and advertising. Rent, salaries, income tax and other excluded items need a broader model.
Should I use gross sales or net sales?
Use a clearly defined revenue basis and match it to the threshold. Here, R reflects discounts, actual product refunds and retained customer shipping; Q follows the separately stated platform definition.
What if contribution before ads is zero or negative?
There is no positive ad allowance. At zero contribution, any positive ad spend makes the result negative. With negative contribution, the unchanged orders already fall short before ads.
Does passing the threshold prove the ads caused the sales?
No. Attribution assigns credit; it does not by itself establish incremental sales. An order contribution calculation cannot replace an incrementality study.